Monitoring PostgreSQL Performance with pg_stat_statements extension

Monitoring PostgreSQL Performance with pg_stat_statements extension
Monitoring PostgreSQL performance is essential if you want to have a highly-performant app. To do so, there are tools to leverage to be able to detect slow-running queries and take action.
In this tutorial, we will dig deep into the pg_stat_statements extension. You will not only detect slow-running queries, but also see other metrics like the number of calls, standard deviation, cache-related metrics, and others that you can monitor to have a performant application.
In each section, we will see what the extension can provide and how Datasentinel can make it easy for you in terms of visualization and well-defined monitoring each minute the queries run and in some cases the precision is a few seconds.
Interactive Demo: Uncover Insights with pg_stat_statements
Begin your deep dive into PostgreSQL’s pg_stat_statements with our interactive demo.
Experience firsthand how this extension enhances query performance and understanding.
This quick, hands-on introduction sets the stage for the detailed discussion to come, providing immediate insights into the power of pg_stat_statements.
What is pg_stat_statements?
The pg_stat_statements extension is a powerful tool in PostgreSQL that provides a means to track execution statistics of all SQL statements executed by a server. This extension is instrumental in monitoring and fine-tuning the performance of a database.
Once enabled, it provides detailed columns covering everything from user and database identifiers to execution times, row counts, and I/O statistics, offering comprehensive insights for query analysis and optimization.
Detailed columns of pg_stat_statements in PostgreSQL 16:
postgres=# \d pg_stat_statements
                      View "public.pg_stat_statements"
         Column         |       Type       | Collation | Nullable | Default
------------------------+------------------+-----------+----------+---------
 userid                 | oid              |           |          |
 dbid                   | oid              |           |          |
 toplevel               | boolean          |           |          |
 queryid                | bigint           |           |          |
 query                  | text             |           |          |
 plans                  | bigint           |           |          |
 total_plan_time        | double precision |           |          |
 min_plan_time          | double precision |           |          |
 max_plan_time          | double precision |           |          |
 mean_plan_time         | double precision |           |          |
 stddev_plan_time       | double precision |           |          |
 calls                  | bigint           |           |          |
 total_exec_time        | double precision |           |          |
 min_exec_time          | double precision |           |          |
 max_exec_time          | double precision |           |          |
 mean_exec_time         | double precision |           |          |
 stddev_exec_time       | double precision |           |          |
 rows                   | bigint           |           |          |
 shared_blks_hit        | bigint           |           |          |
 shared_blks_read       | bigint           |           |          |
 shared_blks_dirtied    | bigint           |           |          |
 shared_blks_written    | bigint           |           |          |
 local_blks_hit         | bigint           |           |          |
 local_blks_read        | bigint           |           |          |
 local_blks_dirtied     | bigint           |           |          |
 local_blks_written     | bigint           |           |          |
 temp_blks_read         | bigint           |           |          |
 temp_blks_written      | bigint           |           |          |
 blk_read_time          | double precision |           |          |
 blk_write_time         | double precision |           |          |
 temp_blk_read_time     | double precision |           |          |
 temp_blk_write_time    | double precision |           |          |
 wal_records            | bigint           |           |          |
 wal_fpi                | bigint           |           |          |
 wal_bytes              | numeric          |           |          |
 jit_functions          | bigint           |           |          |
 jit_generation_time    | double precision |           |          |
 jit_inlining_count     | bigint           |           |          |
 jit_inlining_time      | double precision |           |          |
 jit_optimization_count | bigint           |           |          |
 jit_optimization_time  | double precision |           |          |
 jit_emission_count     | bigint           |           |          |
 jit_emission_time      | double precision |           |          |
Installing pg_stat_statements extension
PostgreSQL does not come by default with the pg_stat_statements extension. Rather, you need to install it beforehand and be able to use the Datasentinel solution as well.
Consult the documentation for guidance on installing pg_stat_statements .
You need to take a look at where your config file resides on your machine.
To figure out that, you need to run the following command:
$ sudo -u postgres psql -c "SHOW config_file;"
[sudo] password for <username>:
               config_file
-----------------------------------------
 /etc/postgresql/12/main/postgresql.conf
(1 row)
The returned path indicates where it lives.
In my case for an Ubuntu machine and a PostgreSQL 12 version, the file is in this path: /etc/postgresql/12/main/postgresql.conf.
You need to edit that PostgreSQL config file. Make sure to use sudo to activate the super user, and you may edit it with vim or your desired text editor.
sudo vim /etc/postgresql/12/main/postgresql.confInside the file, you can search for the shared_preload_libraries keyword.
You’ll find it commented, so uncomment it and assign the string ‘pg_stat_statements’ to it.
You can also configure parameters like pg_stat_statements.track.
In our case, we set it to all to control both top-level statements (those directly issued by clients) and to track nested statements (like statements invoked within functions).
If you want to add more parameters, you can consult the pg_stat_statements documentation.
So an edit for that file could look like the following:
shared_preload_libraries = 'pg_stat_statements' # (change requires restart)
pg_stat_statements.track = all
As you can see from the comment above, changing this shared_preload_libraries requires restarting PostgreSQL server.
That’s because the pg_stat_statements extension requires additional shared memory.
If you want to remove pg_stat_statements extension, you’ll also need to restart the server.
To restart the PostgreSQL server, open your terminal and run the following systemctl command:
sudo systemctl restart postgresqlNow, you’re ready to use the extension.
You can create the extension and then check if it exists already in the pg_extension catalog:
CREATE EXTENSION pg_stat_statements;

SELECT current_database(), extname
FROM pg_extension
WHERE extname ='pg_stat_statements';
The pg_stat_statements extension comes with two views:
- pg_stat_statments which collects metrics about your SQL statements planning and execution.
- pg_stat_statements_info which collects metrics about the queries of pg_stat_statements view itself.
Let’s figure out what’s inside that pg_stat_statments view:
SELECT * FROM pg_stat_statements;In this view, you’ll find various statistics about SQL queries you’ve run in your databases.
To dig deeper into this view, we will use the pgbench program to benchmark multiple queries.
Benchmarking PostgreSQL performance with pgbench
The pgbench tool is a simple program to run benchmark tests on a PostgreSQL database.
By default, it involves five SELECT, UPDATE, and INSERT commands per transaction.
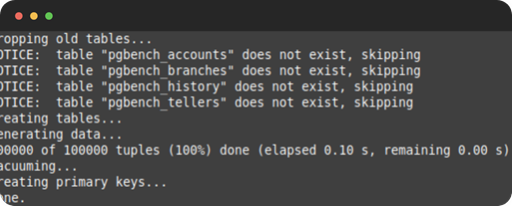
To use this program, we will first create a new database:
sudo -u postgres psql -c "CREATE DATABASE bench;"And then initiate pgbench with the -i option and then the database that we’ve just created:
sudo -u postgres pgbench -i benchNow, invoking the initialization begins:
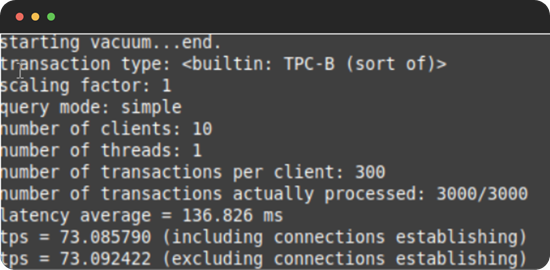
To run the pgbench program, you can use the pgbench command with the options as in the pgbench documentation :
sudo -u postgres pgbench -c10 -t300 benchIn this example, we’ve used the -c option with 10 to indicate that we need 10 clients to
simulate running the queries which indicate the number of database sessions.
Additionally, specifying the -t option with a 300 value indicates that there are 300 transactions run by
each client.
When you apply this pgbench command, you’ll see statistics like the following
Getting top queries in PostgreSQL
Top queries are the most consuming queries according to a chosen attribute.
One example to show top queries according to a total execution time attribute could be:
postgres=# \x
postgres=#
SELECT query,
       calls,
       rows,
       total_time / 1000 AS total_time_in_seconds,
       max_time / 1000 AS max_time_in_seconds,
       stddev_time / 1000 AS staddev_time_in_seconds,
       100.0 * shared_blks_hit / nullif(shared_blks_hit + shared_blks_read, 0) AS hit_percent
FROM pg_stat_statements
ORDER BY total_time DESC
LIMIT 5;

-[ RECORD 1 ]-----------+-----------------------------------------------------------------------------------------------------
query                   | UPDATE pgbench_branches SET bbalance = bbalance + $1 WHERE bid = $2
calls                   | 3000
rows                    | 3000
total_time_in_seconds   | 197.49931732199985
max_time_in_seconds     | 1.298062067
staddev_time_in_seconds | 0.09184763949400729
hit_percent             | 100.0000000000000000
-[ RECORD 2 ]-----------+-----------------------------------------------------------------------------------------------------
query                   | UPDATE pgbench_tellers SET tbalance = tbalance + $1 WHERE tid = $2
calls                   | 3000
rows                    | 3000
total_time_in_seconds   | 159.26389890899975
max_time_in_seconds     | 1.609480054
staddev_time_in_seconds | 0.10899598733832118
hit_percent             | 100.0000000000000000
-[ RECORD 3 ]-----------+-----------------------------------------------------------------------------------------------------
query                   | UPDATE pgbench_accounts SET abalance = abalance + $1 WHERE aid = $2
calls                   | 3000
rows                    | 3000
total_time_in_seconds   | 0.27742859999999997
max_time_in_seconds     | 0.001197972
staddev_time_in_seconds | 4.2213945207636455e-05
hit_percent             | 100.0000000000000000
-[ RECORD 4 ]-----------+-----------------------------------------------------------------------------------------------------
query                   | SELECT abalance FROM pgbench_accounts WHERE aid = $1
calls                   | 3000
rows                    | 3000
total_time_in_seconds   | 0.08000848799999999
max_time_in_seconds     | 0.00023683399999999998
staddev_time_in_seconds | 1.3027023284157596e-05
hit_percent             | 100.0000000000000000
-[ RECORD 5 ]-----------+-----------------------------------------------------------------------------------------------------
query                   | INSERT INTO pgbench_history (tid, bid, aid, delta, mtime) VALUES ($1, $2, $3, $4, CURRENT_TIMESTAMP)
calls                   | 3000
rows                    | 3000
total_time_in_seconds   | 0.07655225799999989
max_time_in_seconds     | 0.00050978
staddev_time_in_seconds | 1.9044452251022967e-05
hit_percent             | 99.9348321928967090
We’ve used \x command in the psql shell to turn on the expanded table formatting mode of our queries.
The query we’ve used gets the top 5 SQL statements that have the most consumed total execution time. In other words, they are the slowest 5 queries.
The query gets the following:
- The query column to indicate the SQL statement.
- The calls column to indicate how many calls this query is run.
- The rows column to indicate how many rows this query retrieves.
- The total_time_in_seconds column to indicate the total number of seconds all calls to this query accumulate.
- The max_time_in_seconds column to indicate the maximum time a single call to this query has reached.
- The stddev_time_seconds column to indicate the standard deviation of running this query a certain number of calls.
- The hit_percent column to indicate the percentage of the shared_blks_hits over the sum of itself plus shared_blks_read. This shows what percentage of the blocks needed is found in the cache. 100 is the best value, showing that only cached blocks are needed.
Consult the user guide for instructions on utilizing the Top Queries feature in Datasentinel.
To get more demonstrated results, you can use the Top Queries feature in real-time through our Demo Site.
This feature gets the most consuming queries according to the following dimensions:
- Total time
- Total time
- Calls
- Rows
- Shared blocks hit
- Shared blocks read
- Shared blocks dirtied
- Shared blocks written
- Temporary blocks read
- Temporary blocks written
- Read time
- Write time
- Local blocks hit
- Local blocks read
- Local blocks dirtied
- Local blocks written
- WAL size (since Postgres 13)
The Datasentinel dashboard can display queries information in multi-dimensional plots while you can select a specific time, zoom in time, and filter with tags.
Let’s take a look at what the Top Queries looks like in this dashboard:
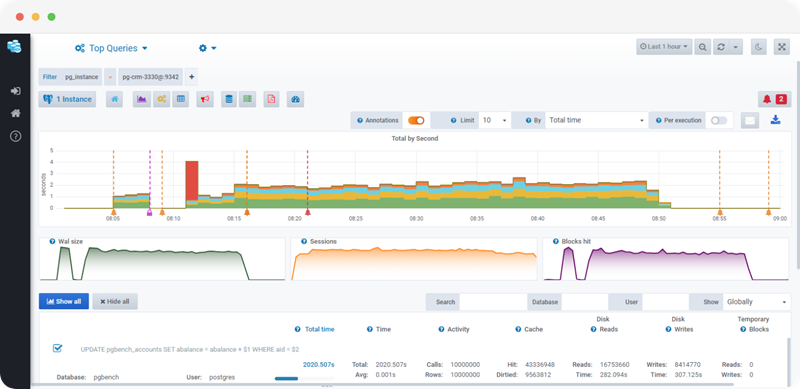
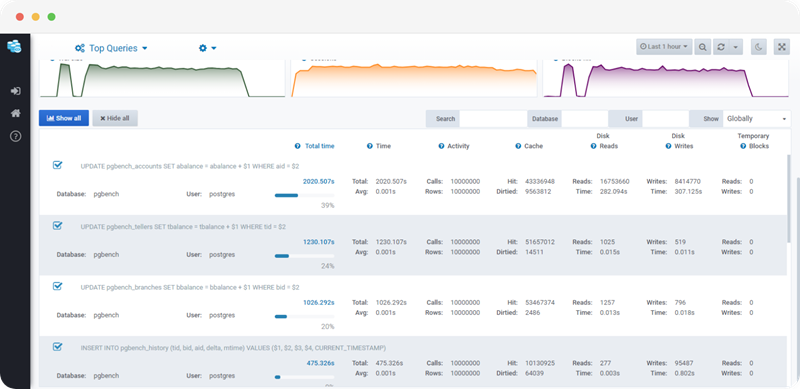
As you can see, this dashboard is filtered on the top 10 queries that consume a certain dimension the most. The dimensions can be filtered by clicking on the drop-down that is selected to be the total time by default.
When you scroll down this dashboard, you’ll see a table with a breakdown of each query of these top 10:
Measuring query statistics
To get statistics for each query, you need to click on the query to navigate more into detailed metrics.
Clicking on a query takes you to a page that shows such metrics:
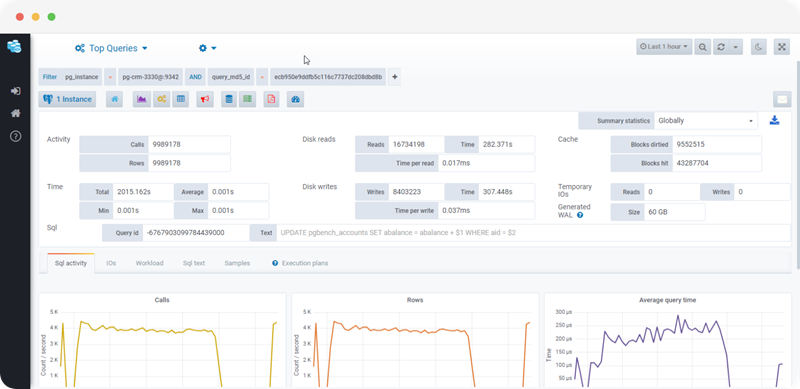
As you can see, it filters the metrics by the query id and shows very similar results to the pg_stat_statements columns.
If you scroll down a bit, you’ll find a dashboard of multiple dimensions across time:
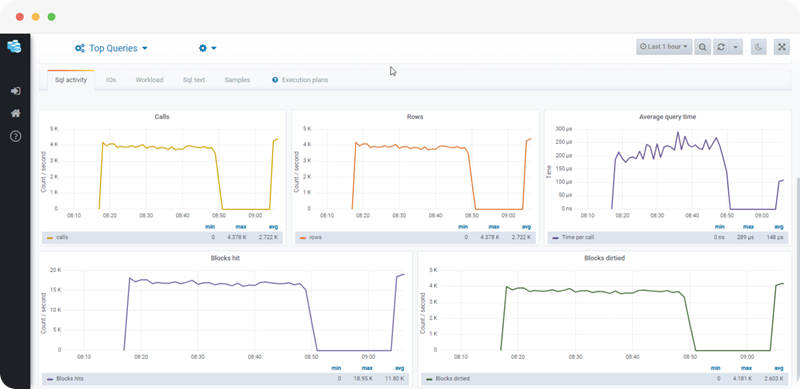
This is the SQL activity tab which shows the calls, rows, average query time, blocks hit, and blocks dirtied all across the time axis.
Tracking session history
Consult the user guide for instructions on utilizing the Session History feature in Datasentinel.
If you click on the drop-down at the top left corner of the Datasentinel dashboard, you’ll see one of the results is Session History.
This metric gets the weight of every database session you’re running.
You can take a look here:
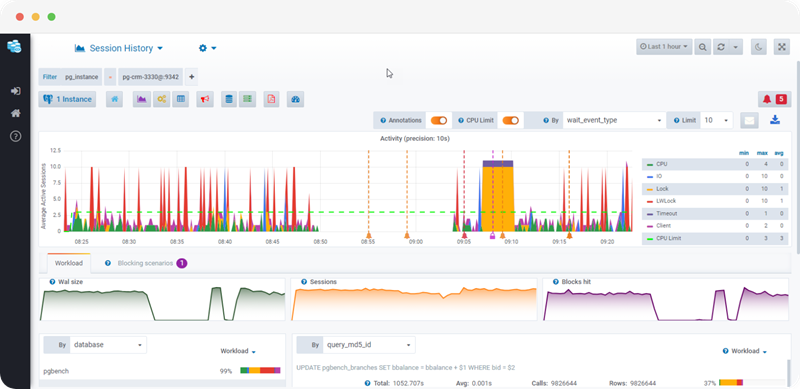
The x-axis dimension for all diagrams is window time.
However, the y-axis on the longest chart shows the average active sessions. An active session is a session currently running the query.
Each colored area on the graph shows, by default, the wait_event_type dimension (CPU, I/O, Client, Lock) with respect to the CPU limit. The session can be using CPU, performing I/O operations through user interaction, can be using a certain SQL client, or waiting for a resource (lock).
Datasentinel collects the active sessions from the pg_stat_activity system catalog on PostgreSQL every 10 seconds. Refer to the documentation about Session History for more details
The three diagrams right beneath the active sessions diagram show the Wal size, how many sessions are in total, and how many blocks are hit. Each diagram shows the associated information from the pg_stat_statements view.
When you scroll down a bit, you’ll see the following:
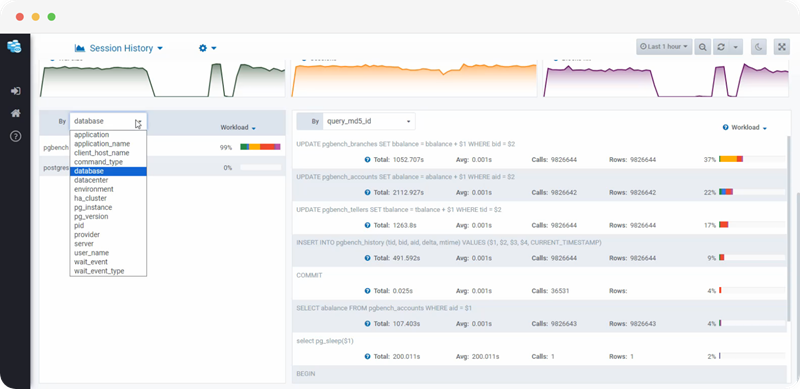
If you click on the drop-down on the left, you’ll find the same list of all dimensions that you can show statistics of. Here, you can find the percentage of each metric and see how much each contributes.
If you try out this drop-down and change it to the database for example, you’ll see how much each database contributes to the sessions workload.
On the right, you’ll see a breakdown of each query run by the sessions and how much it contributes to the workload so that you can improve its performance.
pg_stat_statements metrics (total execution time, average time, number of calls, and number of rows) are then displayed under each query.
Interactive Demo
Conclusion
This tutorial has covered how to install pg_stat_statements extension on PostgreSQL. We’ve learned how to benchmark dummy tests with a certain number of clients and transactions run by each using pgbench program.
We’ve seen how to get top queries that may be considered the slowest-running queries or the queries that have the highest number of calls, or other metrics.
We’ve finally figured out how Datasentinel can make it easy to monitor the top queries, detailed metrics of each query, and sessions workload in a visual way; through dashboards and a detailed breakdown for each metric.
Discover more about this key feature and others in Datasentinel by visiting our Documentation, your gateway to enhanced PostgreSQL performance.