Efficiently Track Your PostgreSQL High Availability Architecture's Performance with Datasentinel
By using this feature, you can easily keep track of the workload on your instances, including Read Replicas.
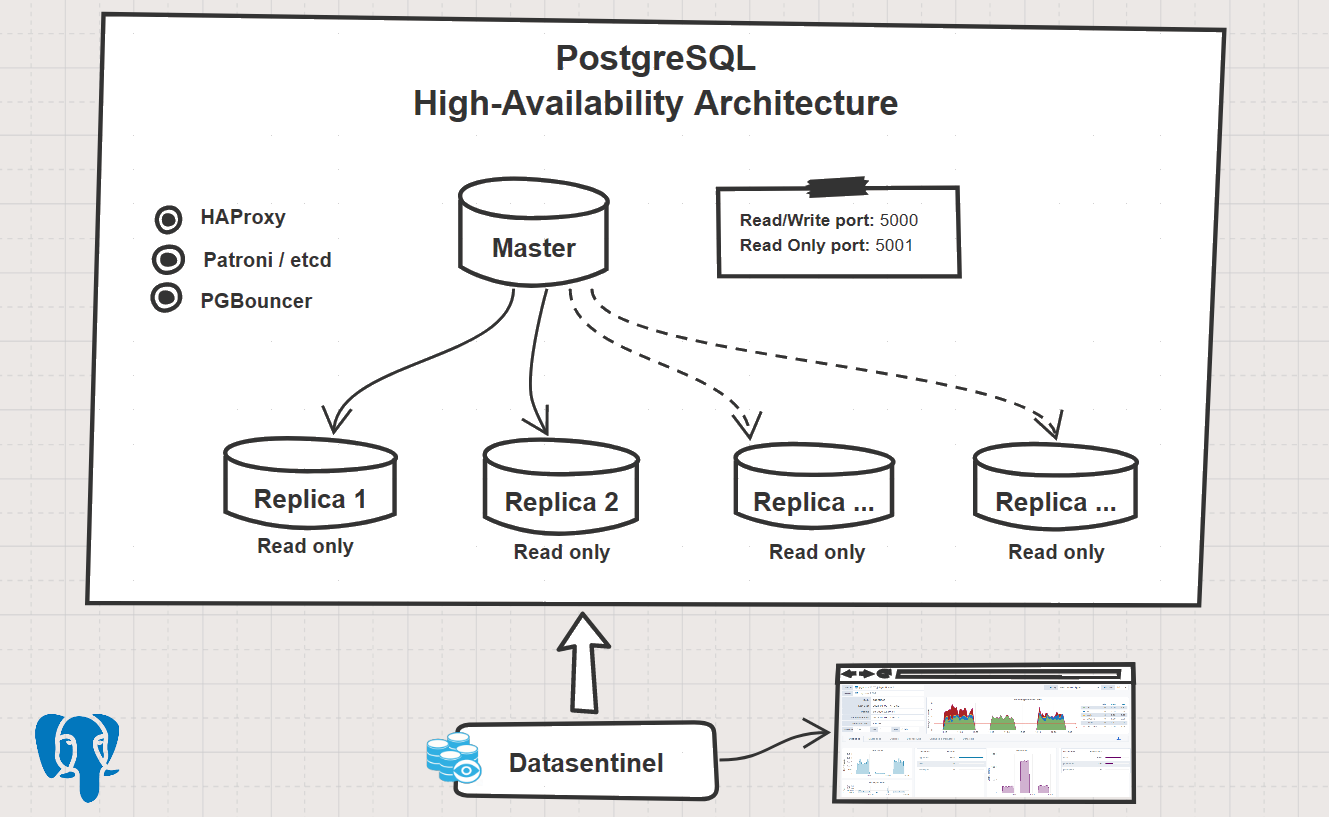
This article demonstrates the benefits of Datasentinel on a Patroni-managed HA PostgresQL Architecture with etcd.
The architecture consists of three instances, including one Master and two Read Replicas, utilizing HaProxy for load-balancing and PgBouncer as a connection pooler.
To set up this HA architecture, we used the Postgresql Cluster project playbook on Github via ansible.
The benchmark was performed using Pgbench, which included two sets of tests: one for read/write operations and the other for read-only.
For more information on PostgreSQL HA and its administration, please refer to the official documentation .
Datasentinel configuration
You need to connect the three clusters directly without relying on a load balancer.
Choose from two configuration methods:
- Install and configure a local agent on each server hosting an instance. Refer to the Agent Installation guide for instructions.
OR
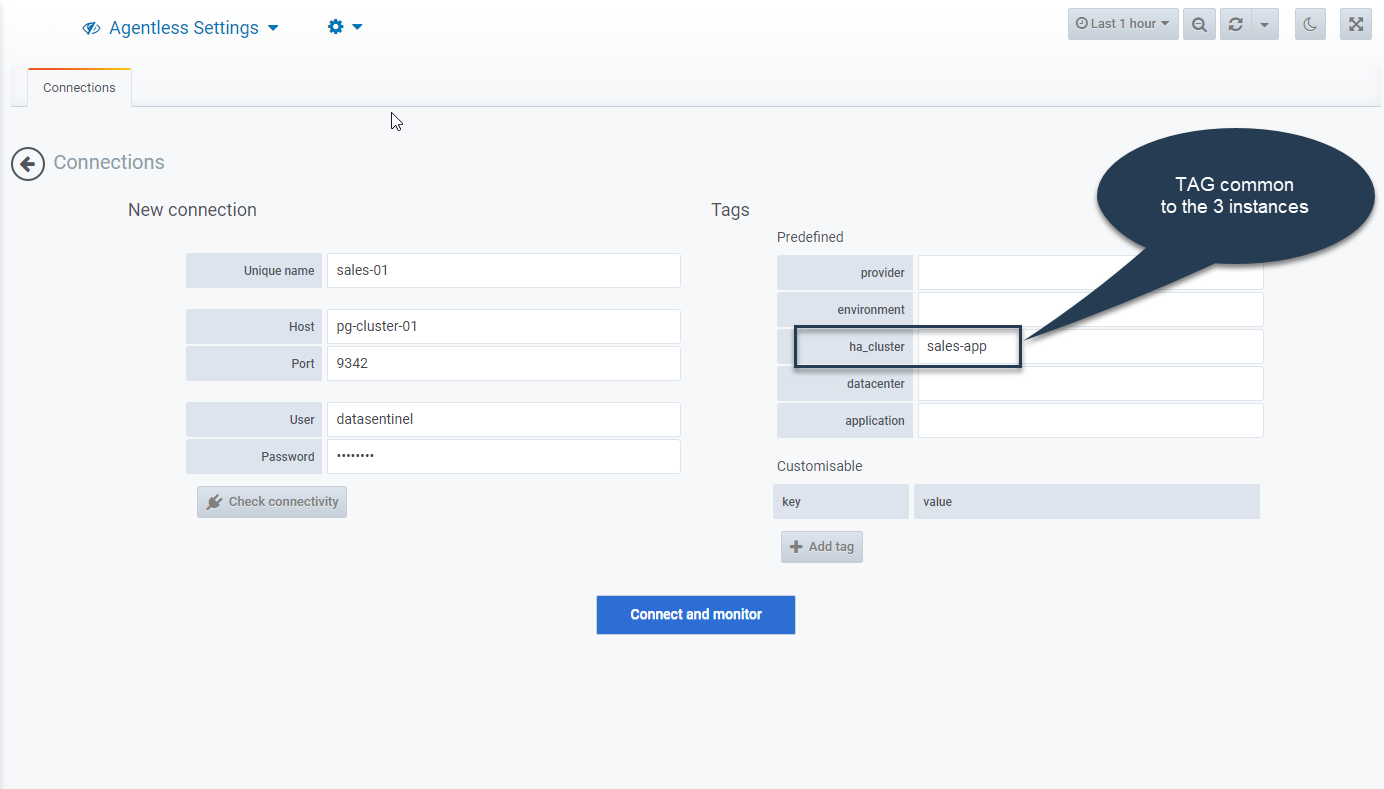
- Set up a connection for each cluster using the AgentLess method, directly from the platform UI or via the API
Make sure to specify a common property, or TAG, for all three instances.
For efficient usage of TAGs with Datasentinel, refer to the How to use TAGs efficiently with Datasentinel guide.
For this scenario, we have chosen to use the “ha_cluster” TAG to identify the high availability architecture. All three instances will be assigned the tag “ha_cluster=sales-app”.
Example Configuration for Agentless Mode
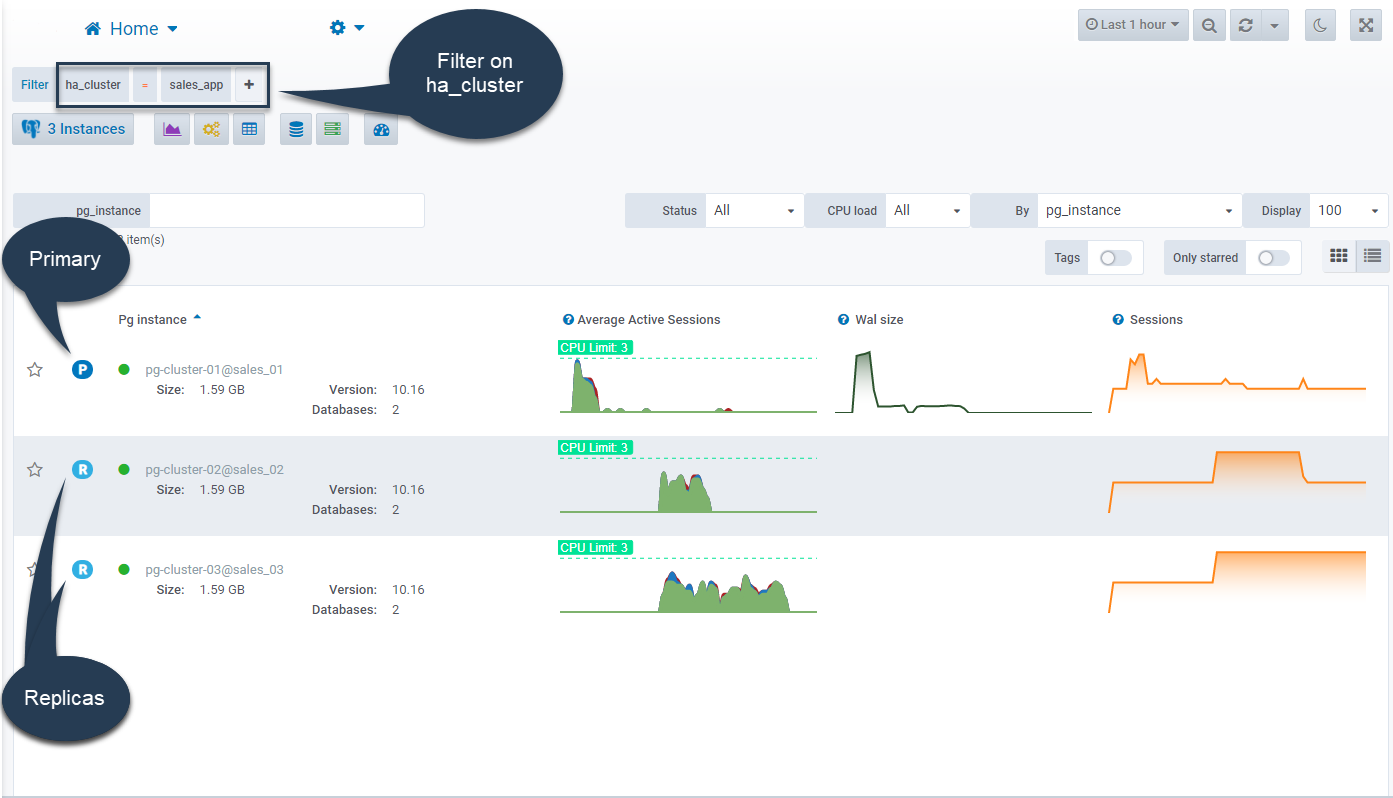
Visualizing the High Availability (HA) Architecture
To view your 3-instance architecture, apply the filter “ha_cluster = sales-app” from the homepage.
Additionally, you can track activity metrics for each cluster.
Analyze the Overall Activity of Your Instances
The Active Session History, Top Queries, and Top Tables & Indexes modules provide both consolidated and detailed views of your instances.
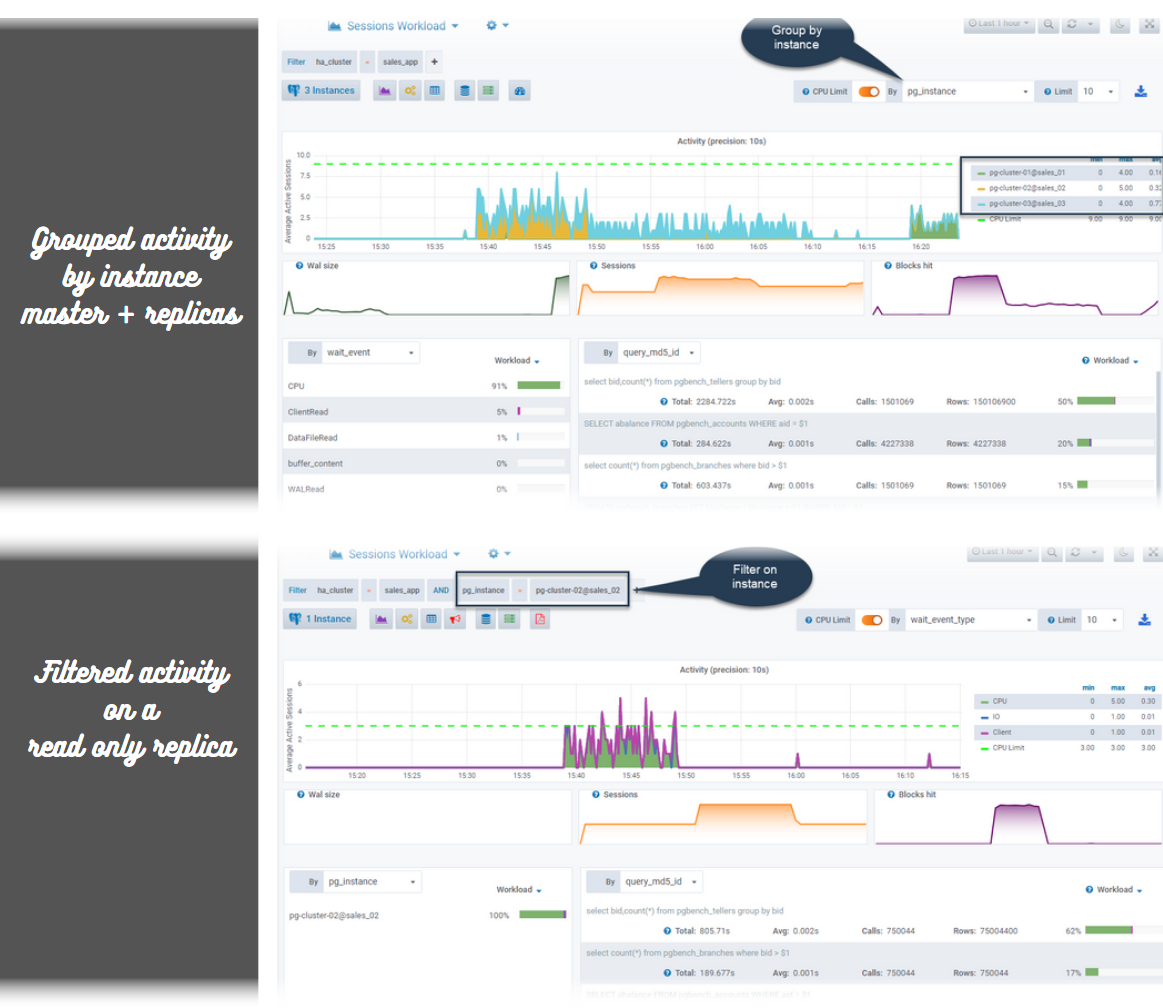
The Active Session History module allows you to quickly visualize the overall activity of your High-Availability architecture, along with identifying the queries or sessions with the greatest impact.
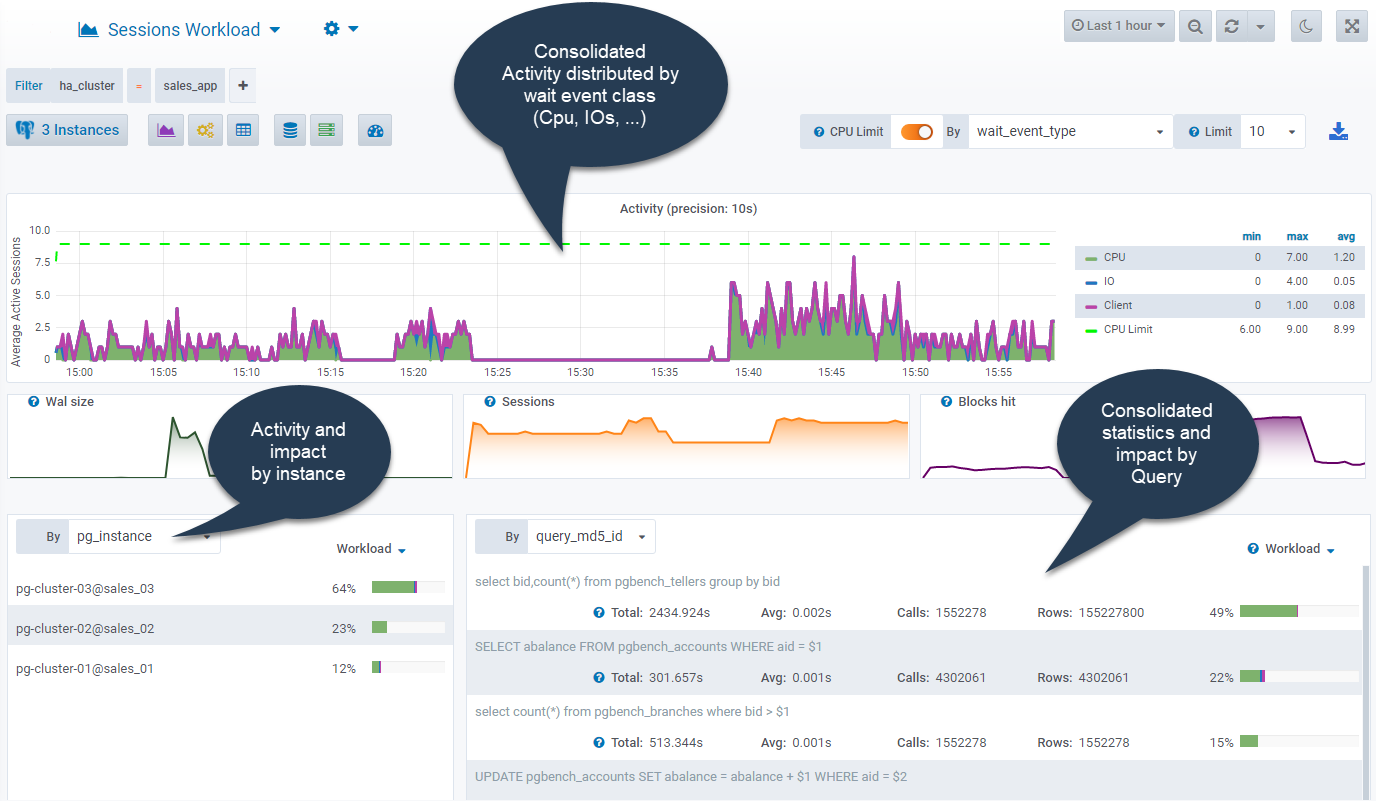
This module provides several options to visualize activity, including filtered by instance or consolidated views.
The following examples provide a brief overview.
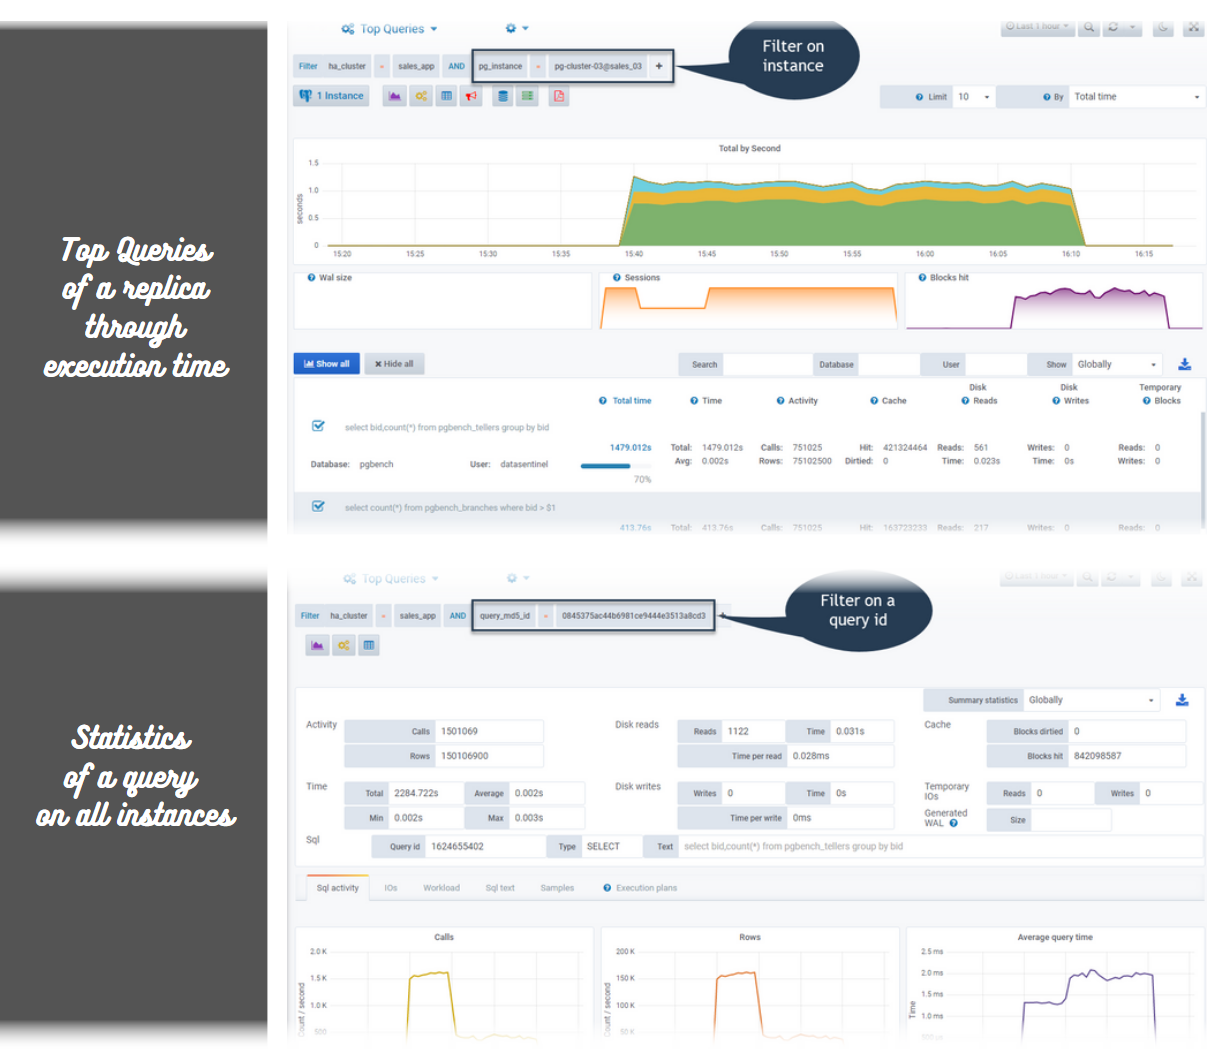
The Top Queries module, utilizing metrics from the pg_stat_statements extension, enables quick identification of the most resource-intensive queries based on specific dimensions.
For instance, you can display the queries that require the most disk reads or those with high execution times, and even drill down into a specific query.
Here are two examples:
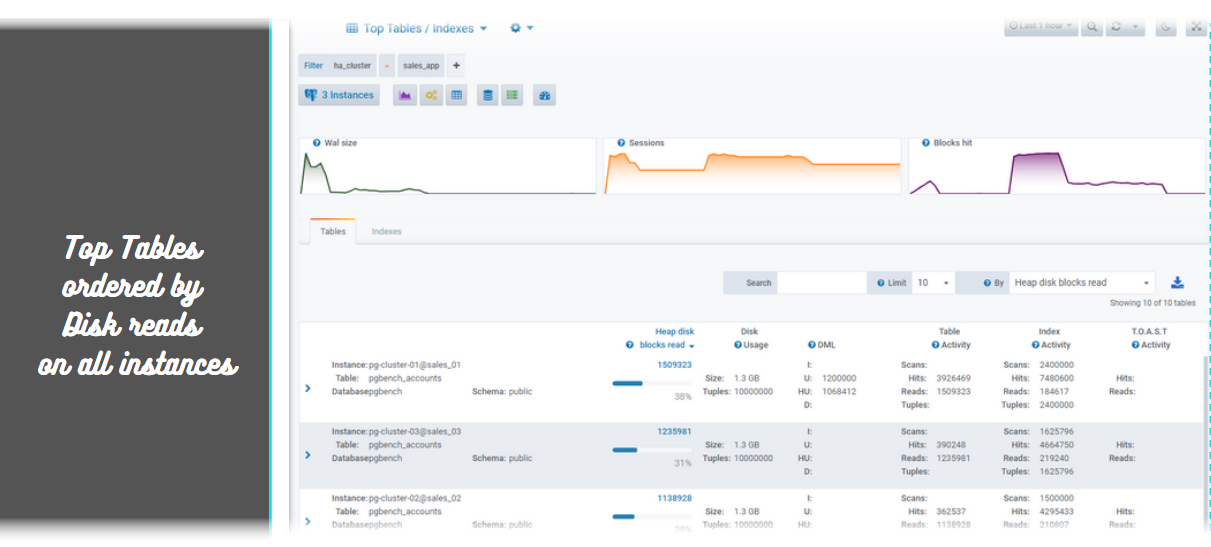
Similar to the Top Queries module, you can display the Top Tables & Indexes module on a specific dimension (such as disk reads or cache access), filtered by instance or consolidated.
Here’s an example:
Viewing replication statistics
Datasentinel logs replication statistics, enabling you to quickly view the WAL delta size to replicate and the replication delay for each replica of a cluster.
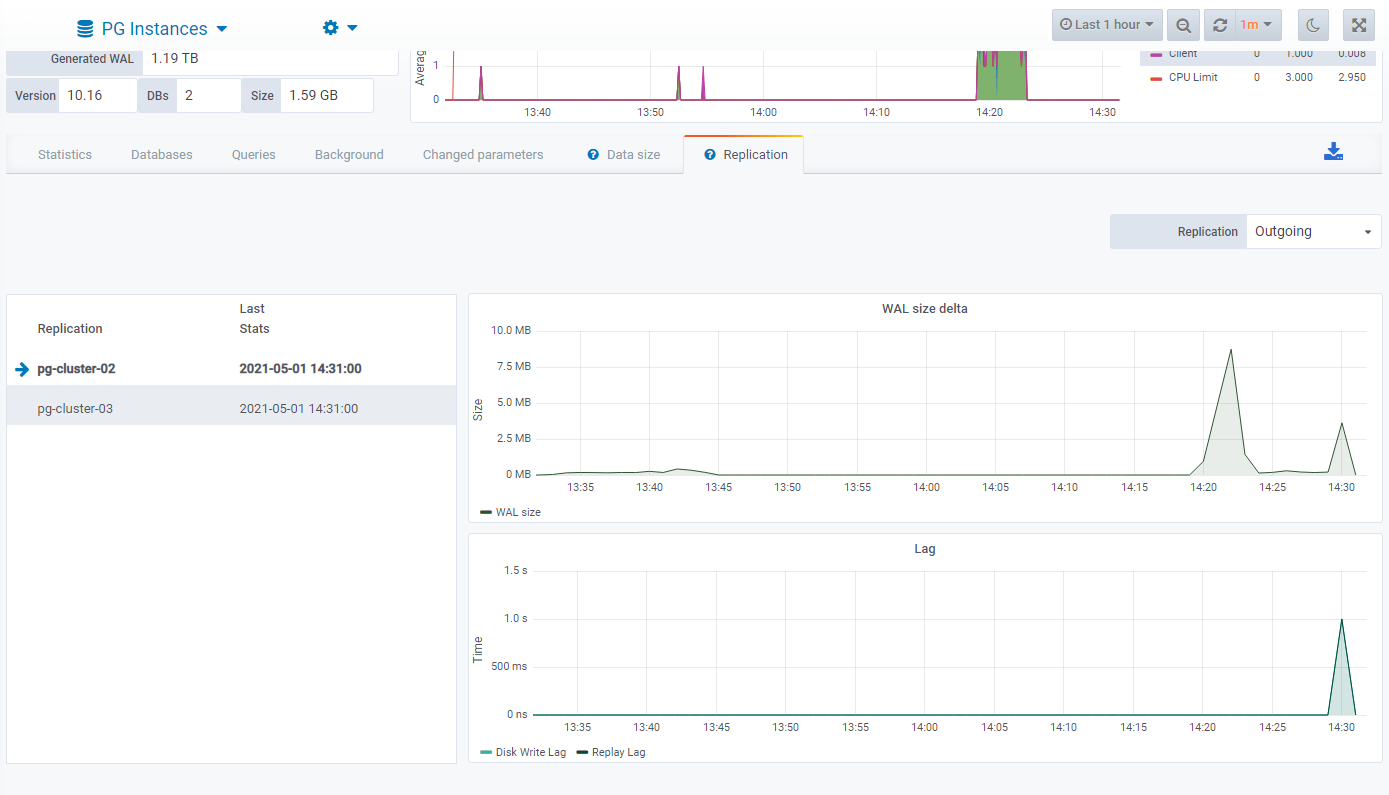
Datasentinel is compatible with read replicas of managed PostgreSQL clusters from major public cloud providers such as Amazon RDS, Microsoft Azure, and Google Cloud.
Conclusion
Explore the features discussed in this article and much more, by visiting our Demo Site .
Datasentinel provides accurate performance monitoring tailored for your mission-critical PostgreSQL High Availability (HA) instances. Its specialized features and intuitive interface make it effortless to analyze the workload of both HA and non-HA Postgres instances.
Leverage Datasentinel to swiftly gain valuable insights into your database performance and proactively take steps for optimization.
Stay connected!
If you’re an AWS customer, get started quickly with Datasentinel’s presence on the AWS marketplace.