Discover the advanced reporting features present in Datasentinel
How activity reports allow you to analyze precisely the performance of your clusters?
This article describes the different ways to use activity reports to complete your analyses
These reports can thus be shared between teams, set aside for later comparison, sent to a software publisher.
The examples of use are numerous.
They are perfect for analysis a posteriori of the activity of your clusters during performance problems
The reports
Reports are created in PDF format and include time graphs and statistical data
Predefined reports
| Report | Description |
|---|---|
| Session History | Active session history report with impact on overall activity |
| Top Queries | Most consuming queries calculated on a particular dimension (by execution time for example) |
| Top Tables / Indexes | Activity statistics of tables and indexes calculated on a particular dimension (by disk reads for example) |
| Clusters | Instance activity statistics (IOs, cache, checkpoints, generated WAL, statistics per database, …) |
| Servers | Server statistics (Cpu, IOs , memory, swap, network, file-systems) |
| Data size | Space used by database including the largest tables and indexes |
| Full report | Complete report of the activity containing all the previous elements |
| Detailed report of a query | Complete statistics of a query as well as its associated execution plan(s) (if extension pg_store_plans installed) |
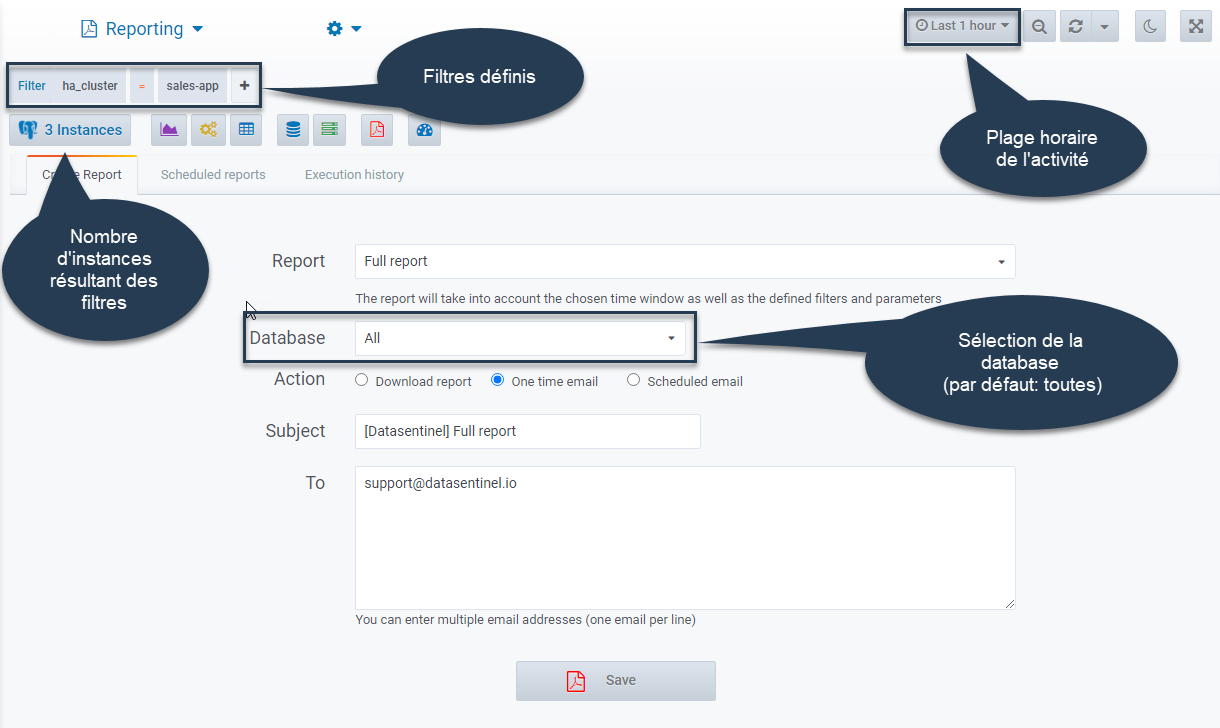
Creation of an activity report
A report can contain activity from one or more clusters and can be filtered on a particular database
The reports are defined as follows:
1. Choice of the activity time range
2. Definition of one or more filters in order to select the desired cluster(s).
It is possible to integrate several clusters in the same report (Cf Instance TAGs)
| Some report examples |
|---|
| Cluster activity report |
| Report including clusters of a high availability architecture: primary cluster + read replicas |
| Production cluster activity report |
| Activity report for all clusters in a datacenter |
3. Choice of a particular database if necessary. By default, the activity of all databases is extracted
4. Report launch.
If the report is initiated from the icon ![]() present on some dashboards, the options of the active dashboard are then preserved. (maximum number of lines, chosen dimension, …)
present on some dashboards, the options of the active dashboard are then preserved. (maximum number of lines, chosen dimension, …)
The report can be generated and downloaded immediately or sent by email to one or more recipients. (Cf Documentation )
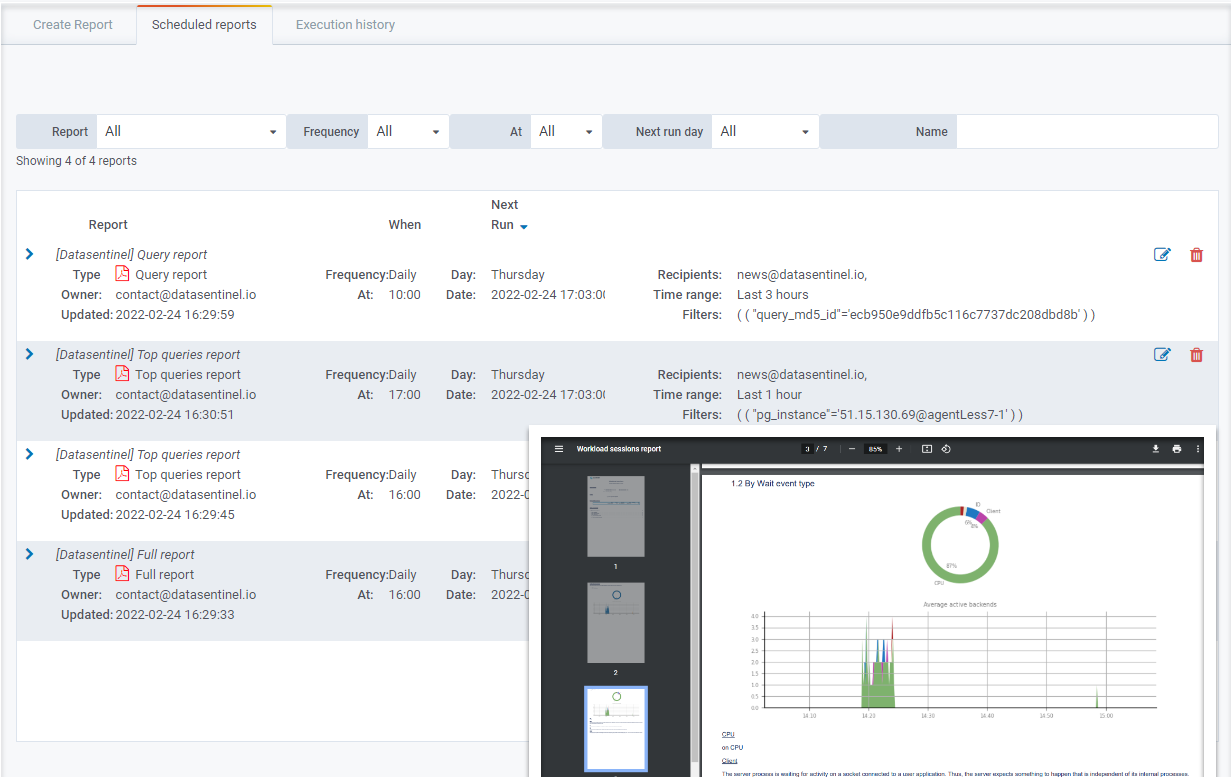
Automate reporting
Automating Datasentinel reports is a process of scheduling an automatically updated report to be sent at a specific time to one or more selected people.
This process is particularly useful when you want to use custom analysis reports.
Automating reports has many benefits
- Focus on the essential: the performance analysis.
- No need to login to the GUI. These reports can be sent to people not declared on the platform.
- Setting aside reports for analysis, later comparison.
To do this, when creating a report, choose the scheduled email option and then fill in its sending characteristics
- Choice of time and day of execution
- Sending frequency: daily or weekly
- Activity time range relative to report run time
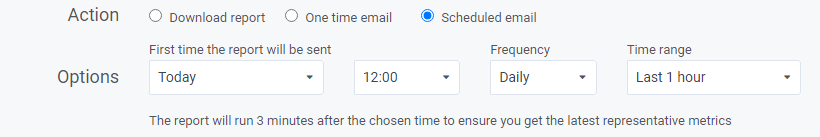
The report will trigger 3 minutes after it is defined, in order to have the latest activity metrics.
(Cf Documentation for complete management)
Trigger reporting via API
Report management via API makes it possible to integrate the execution and sending of reports at specific times (end of a nightly batch processing for example), very useful when you want to have a trace of a particular activity.
The example below creates a full report of a cluster on a filtered database with sending by email
cat > $TMP_JSON_FILE <<EOF
{
    "utc_time": true,
    "from": "2020-02-29 00:00:00",
    "to": "2020-02-29 04:00:00",
    "filters": [
        {
            "tag": "pg_instance",
            "value": "pg-crm-0926@:9342"
        }
    ],
    "database": "pgbench",
    "report_type": "email",
    "subject": "[Datasentinel] Report activity",
    "recipients": ["contact@datasentinel.io"]
}
EOF

export TOKEN=<<ACCESS_TOKEN>>

curl -sk --header "user-token: $ACCESS_TOKEN" --header 'Content-Type: application/json' -X POST https://$DATASENTINEL_HOST//ds-api/activity/full-report -d @$TMP_JSON_FILE
This report management can be included in a DevOps automation flow.
Refer to the API documentation for more details
Conclusion
Activity reports are a precious help allowing precise analyzes a posteriori.
These reports can be shared, stored on disk for later consultation.
Datasentinel unique features and the simplexity of its GUI allow a quick start to easily and precisely analyze the workload of all your Postgres instances
Stay connected!