Introduction to Live360° feature
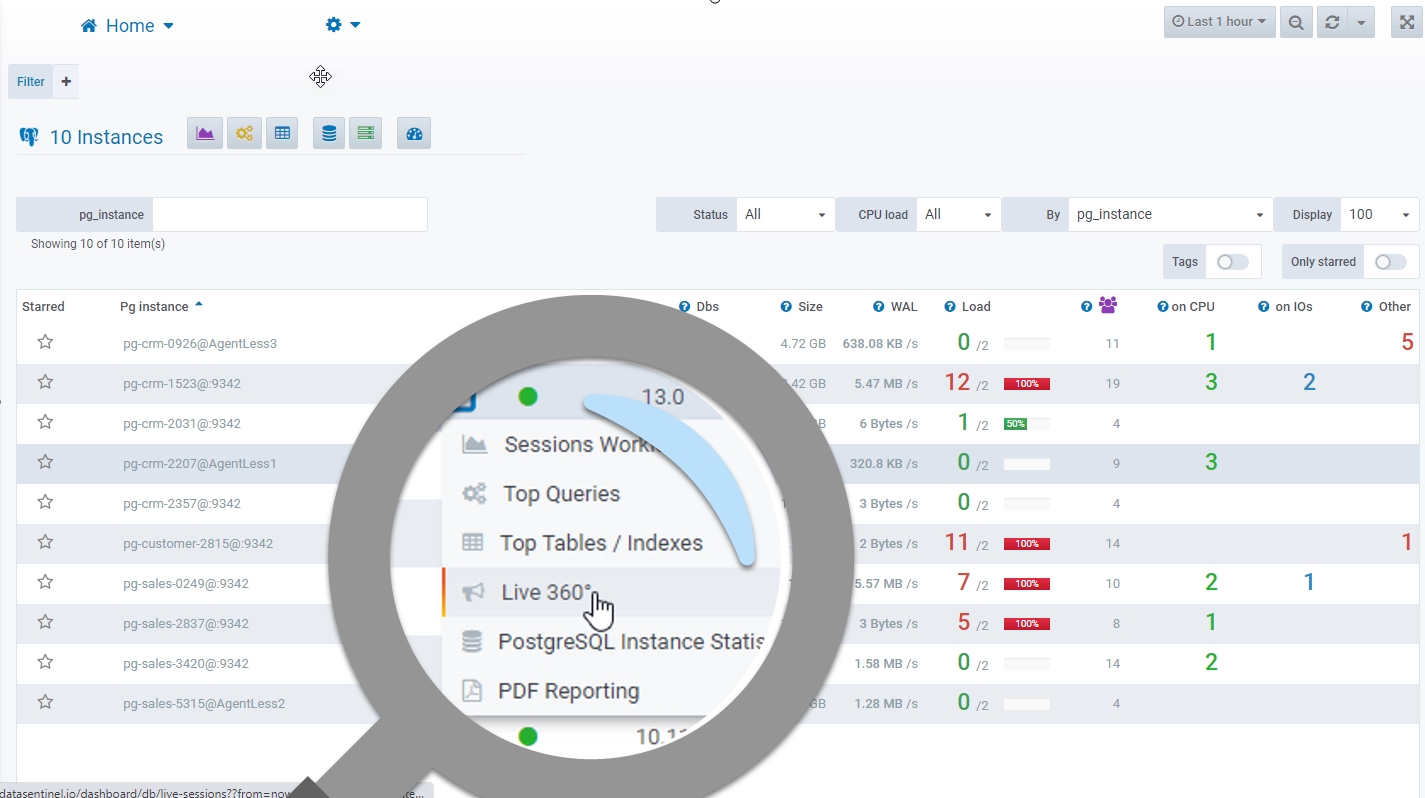
Introducing Live360: Real-Time Access and Monitoring for Your PostgreSQL Clusters
In the dynamic world of database management, real-time access and monitoring are not just luxuries—they are necessities for ensuring peak performance and reliability.
Understanding the critical need for immediate data interaction and observation, we are excited to introduce Live360, our latest feature in Datasentinel.
By providing a seamless, real-time window into your databases' health and performance, Live360 empowers you to make informed decisions, promptly address issues, and optimize your database environment like never before.
Dive into the world of enhanced PostgreSQL management with Live360, where every transaction and query is at your fingertips, empowering you to maintain, optimize, and innovate with unprecedented agility.
This article will guide you through Live360°'s core functionalities and how it can significantly enhance your performance analysis and troubleshooting.
Core Functionalities of Live360
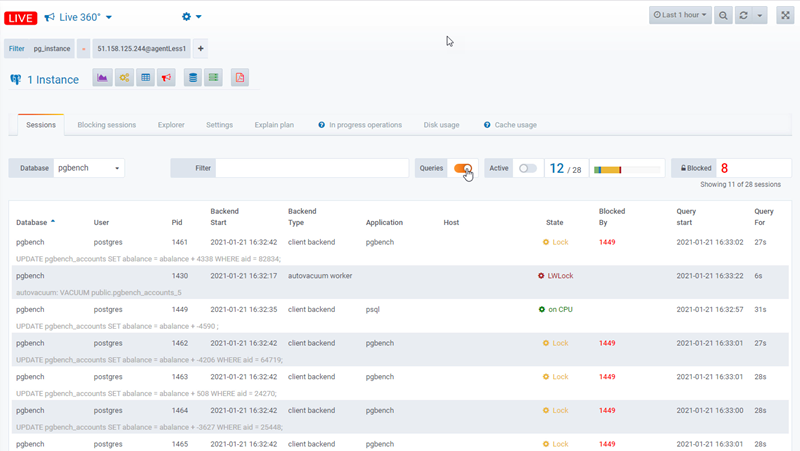
Current Sessions Visualization
- View and filter backends by database or universally, focusing on active sessions.
- Observe session details, including locks, blocking sessions, and current activity status—whether consuming CPU, awaiting I/O operations, or writing WAL, etc …
- Terminate any backend with ease (provided Datasentinel user has the necessary read-write privileges).
- Understand each query’s execution with details on the query being executed, its start time, and duration.
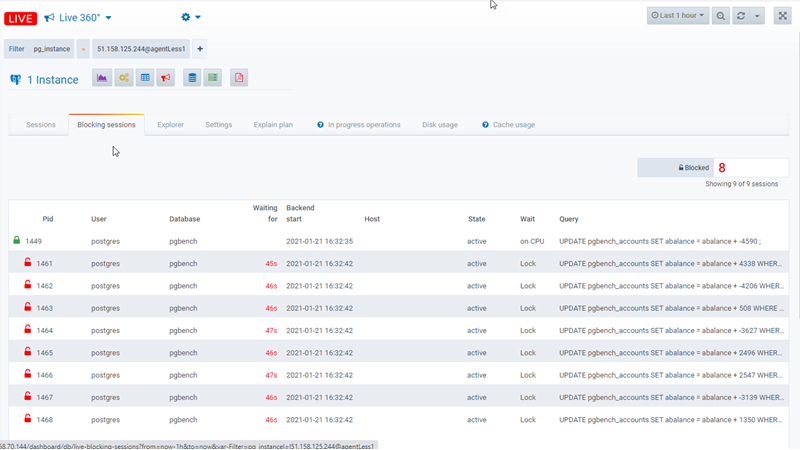
Blocking Sessions Insights
- Quickly identify and visualize blocking and blocked backends, the time spent waiting, and the queries involved.
- Empower your decision-making with the ability to terminate problematic backends. (requires the read write privilege for the Datasentinel user)
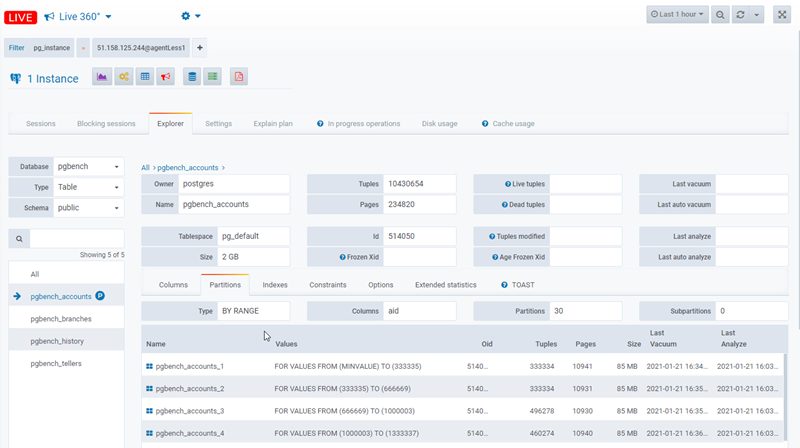
Object Explorer for In-depth Analysis
- Dive deep into the properties and statistics of various relation types across databases and schemas.
- Access a wealth of information, including VACUUM details, table statistics, column statistics, and disk usage insights.
So much information used by the PostgreSQL planner / optimizer to determine an execution plan
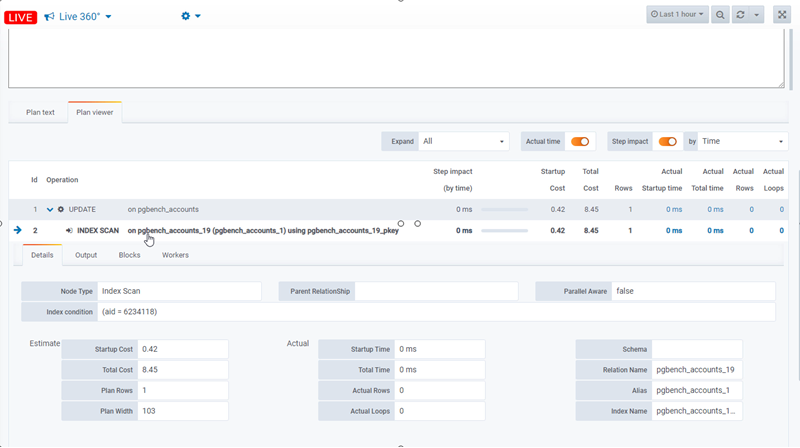
Execution Plans on the Go
- Generate and analyze execution plans dynamically for any query with our integrated viewer, available in text or JSON format.
- Utilize the ANALYZE option for SELECT queries to understand overall and step-by-step execution times.
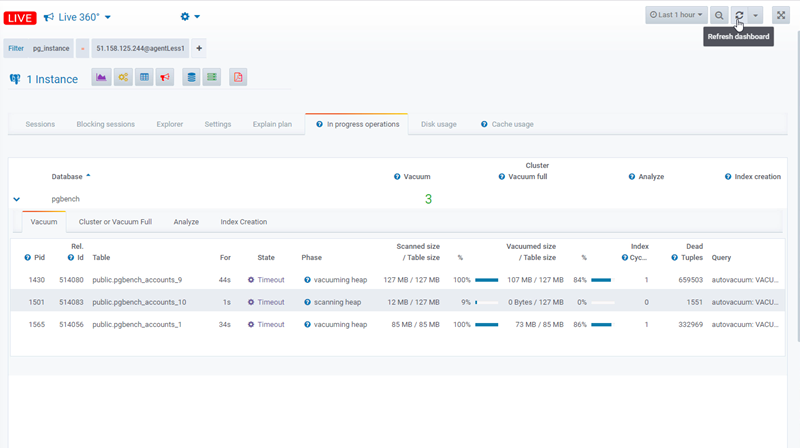
Progress Reporting for Ongoing Operations
- Monitor the progress of essential PostgreSQL operations from version 9.6 onwards, including VACUUM, CREATE INDEX, CLUSTER, and ANALYZE.
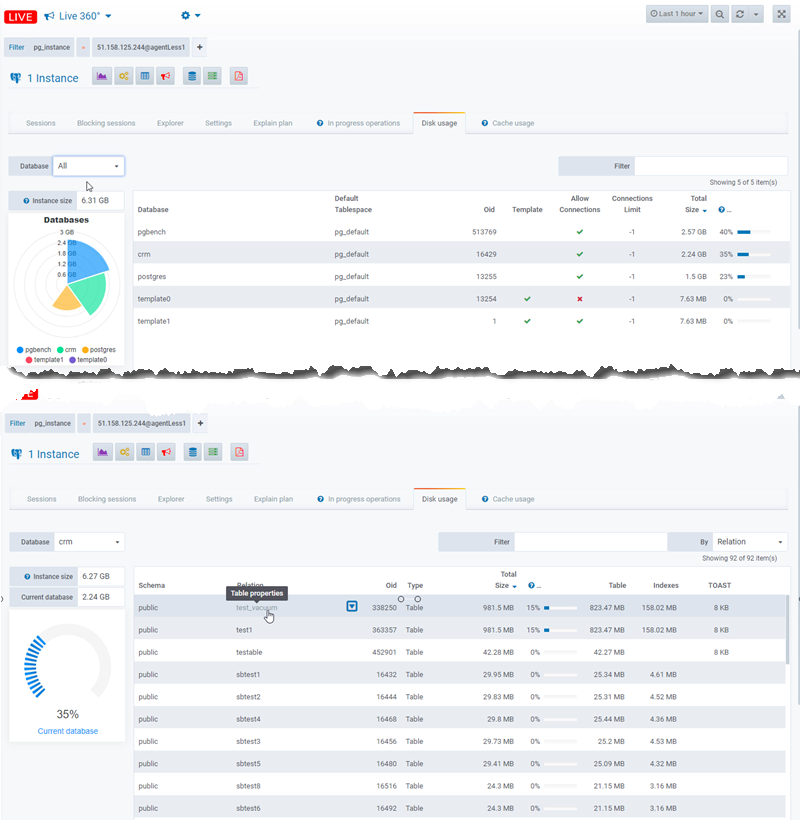
Detailed Disk and Memory Usage Exploration
- Get a granular view of the space utilized by relations in your databases.
- Analyze data distribution and cache usage with the pg_buffercache extension.
Documentation
Explore our Live360 documentation for quick, in-depth PostgreSQL insights.
Conclusion
Live360 grants you a comprehensive, real-time view of your PostgreSQL instances, providing precise context and invaluable insights for performance analysis and troubleshooting. Datasentinel’s unique features and user-friendly interface ensure a quick, efficient, and precise analysis of your Postgres workload.
Embrace the simplicity and sophistication of Live360 to elevate your database management experience.
Stay connected!